THE IDEA IN ONE LINE
Equal company weights reduce the influence of individual giants while changing size, sector, style and trading exposures. Neither weighting rule guarantees higher returns.
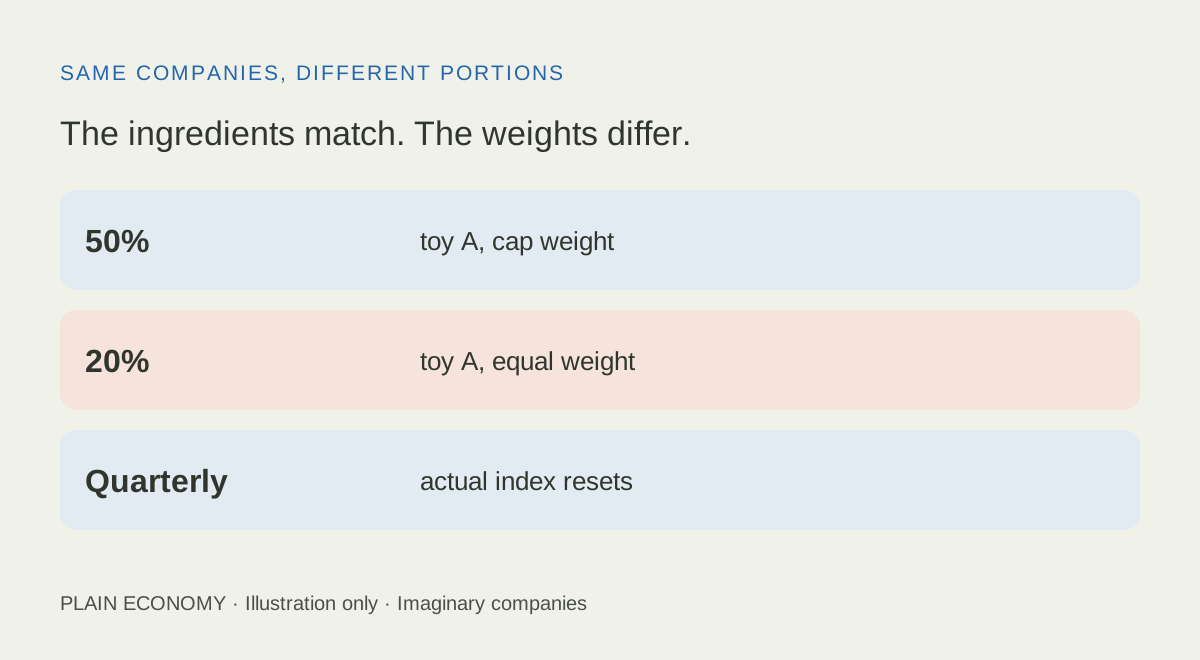
The ingredients match. The weights differ.
50%toy company A, cap weight
20%toy company A, equal weight
Quarterlyreal index reset schedule
50%toy A, cap weight
20%toy A, equal weight
Quarterlyactual index resets
Imagine two shopping baskets containing exactly the same five items. One spends half its money on the biggest item; the other spends one fifth on each. The ingredients match, but the portions change the result. That is the central difference between the S&P 500 and the S&P 500 Equal Weight Index. Equal weighting reduces the influence of individual giants while changing other exposures and requiring periodic resets. It does not guarantee a higher return or remove stock-market risk.
Same companies, different amounts of money
The familiar S&P 500 weights companies by float-adjusted market capitalization. In everyday terms, that starts with share price multiplied by the shares considered available to investors. S&P's float methodology excludes specified strategic holdings. A USD 100 share does not automatically matter more than a USD 10 share: the available share count matters too. Sales, profits and employee numbers do not directly determine the weight.
Equal Weight uses the same constituent companies and targets about 0.2% per company at its quarterly reset. To make the difference visible, replace hundreds of companies with five imaginary ones. Their available market values are 50, 20, 15, 10 and 5 units. A capitalization-weighted USD 100 basket allocates those same dollar amounts. An equal-weight basket allocates USD 20 to each.
The same five companies receive different amounts
Original illustration: dollars invested per USD 100 at the start. Blue: cap weighting; coral: equal weighting. Zero baseline.
See the data
| Imaginary company | Cap dollars per USD 100 | Equal dollars per USD 100 |
|---|---|---|
| A | 50 | 20 |
| B | 20 | 20 |
| C | 15 | 20 |
| D | 10 | 20 |
| E | 5 | 20 |
| Total | 100 | 100 |
The largest company has less influence in the second basket. The four smaller companies collectively have more. These invented weights are not a snapshot of either S&P index. They isolate one rule so that its effect is easy to follow.
The real target is per company, not necessarily per listed share line. S&P's methodology splits a multi-class company's target among its share lines using float-adjusted value at the reference date. Reference prices precede the effective reset, so weights can already move before implementation. They keep drifting as prices change afterwards. “About 0.2% at the quarterly reset” is more accurate than “every security always has exactly 0.2%”.
Which companies rise matters as much as how many
Take the first chart's starting weights. In one hypothetical period, A rises 20% while B through E each fall 5%. A's large starting weight contributes ten percentage points to the cap-weighted result; the other four subtract a combined 2.5 points. The basket gains 7.5%. Equal weighting produces zero: one gain of four points offsets four losses of one point each.
A 7.5% cap-weighted gain can have different leadership
Two independent hypothetical periods, each reset to the first chart's starting weights. Portfolio return, %. Zero baseline.
See the data
| Company or total | Narrow: stock return | Narrow: cap contribution pp | Narrow: equal contribution pp | Broad: stock return | Broad: cap contribution pp | Broad: equal contribution pp |
|---|---|---|---|---|---|---|
| A | +20% | +10.00 | +4.00 | -5% | -2.50 | -1.00 |
| B | -5% | -1.00 | -1.00 | +20% | +4.00 | +4.00 |
| C | -5% | -0.75 | -1.00 | +20% | +3.00 | +4.00 |
| D | -5% | -0.50 | -1.00 | +20% | +2.00 | +4.00 |
| E | -5% | -0.25 | -1.00 | +20% | +1.00 | +4.00 |
| Portfolio return | +7.50% | 0.00% | +7.50% | +15.00% | ||
| Ending USD value | 107.50 | 100.00 | 107.50 | 115.00 |
Now start again from the original weights in a separate case. Let A fall 5% and the other four each rise 20%. Cap weighting still gains 7.5%, but equal weighting gains 15%. The same headline cap-weighted return can therefore sit alongside very different leadership. The table separates company returns, contribution percentage points and whole-portfolio returns.
Neither case predicts the next winner. A gap between real cap-weighted and equal-weight returns describes the period's weighting and exposure effects. It does not independently count every rising stock or establish a buy or sell signal. These examples exclude dividends, costs, tax and currency conversion; they are arithmetic illustrations rather than historical results.
Equal portions drift and need restoring
For a separate reset example, start with USD 20 in each company. A gains 50%, C loses 25%, and the others do not move. The basket grows from USD 100 to USD 105, but A now represents about 28.57% and C about 14.29%. Equal weighting has drifted.
A reset changes the portions without creating a profit
Separate original example, USD values. Blue: before reset; coral: after reset. All positions initially USD 20. Zero baseline.
See the data
| Company | Start USD | Stock return | Before reset USD | Weight before reset | After reset USD | Trade USD, buy positive |
|---|---|---|---|---|---|---|
| A | 20 | +50% | 30 | 28.5714% | 21 | -9 |
| B | 20 | 0% | 20 | 19.0476% | 21 | +1 |
| C | 20 | -25% | 15 | 14.2857% | 21 | +6 |
| D | 20 | 0% | 20 | 19.0476% | 21 | +1 |
| E | 20 | 0% | 20 | 19.0476% | 21 | +1 |
| Total | 100 | +5% portfolio | 105 | 100% | 105 | 0 |
A reset divides USD 105 by five, targeting USD 21 per company before costs. Sell USD 9 of A, buy USD 1 of B, USD 6 of C and USD 1 each of D and E. Sales and purchases balance. The total remains USD 105: restoring the rule creates no immediate profit. Trading costs would reduce the amount available. Selling a relative winner and adding to a relative loser also offers no guarantee about either company's next return.
The actual index resets quarterly with specified reference and effective dates. Membership changes and corporate actions bring additional rules. This teaching basket assumes fractional holdings and simplifies those operational details. Its two-sided trading amount is USD 18; that should not be mistaken for a fund's formally reported annual turnover statistic.
Less giant-company influence comes with other trade-offs
S&P's Equal Weight FAQ describes greater exposure to smaller constituents within the S&P 500, alongside value and anti-momentum tendencies. This remains a portfolio of the parent index's companies, rather than a small-cap index or the whole global market. Different size and style exposures can help or hurt for extended periods.
Equal company weights also do not produce equal sector weights. In a five-company illustration, a sector containing three companies receives 60% at the equal-weight reset. Common economic shocks and US equity risk remain. Concentration has several dimensions; reducing one company's influence does not remove all of them.
Implementation matters too. Invesco's August 2026 RSP summary prospectus reports a 0.20% annual operating expense ratio and 27% portfolio turnover for its latest fiscal year. These are product-specific figures, not charges levied by the index itself. Trading costs are additional to operating expenses; ETF share prices can also differ from net asset value. A fund can diverge from its benchmark because of expenses, trading and other implementation effects.
For a fair comparison, use the same start and end dates, currency and hedging status. S&P distinguishes price return, dividend-reinvesting total return and net total return with assumed dividend withholding. Match gross or net dividend conventions and cumulative or annualized reporting. Compare index with index to study weighting, or fund NAV total return with fund NAV total return to include implementation. Published fund returns already reflecting expenses should not have those expenses deducted a second time; investor spreads, commissions, taxes and FX costs still need separate attention.
The useful choice is therefore which exposure rule fits a clearly defined purpose and cost budget. The label “equal” explains how money is distributed. It cannot settle future performance, suitability or risk on its own.
Optional: reproduce the original calculations
Portfolio return = sum of initial weight fractions × company returns. Narrow case: 0.50 × 20% + 0.50 × (-5%) = 7.5%; equal = (20 − 5 − 5 − 5 − 5)/5 = 0%. Broad case: 0.50 × (-5%) + 0.50 × 20% = 7.5%; equal = (-5 + 20 + 20 + 20 + 20)/5 = 15%. These periods are independent. Reset: 30 + 20 + 15 + 20 + 20 = 105; each target = 105/5 = 21. Sales of 9 finance purchases of 1 + 6 + 1 + 1 = 9. No dividends, fees, taxes or FX effects are included.
Sources and method
- S&P DJI: S&P 500 Equal Weight Index overview
- S&P U.S. Indices Methodology, equal weighting and share classes
- S&P Float Adjustment Methodology
- S&P Index Mathematics Methodology
- S&P DJI: Equal Weight FAQ, April 2026
- Invesco RSP summary prospectus, 28 August 2026, SEC-hosted issuer filing
Sources checked 17 October 2026. All charts use original invented USD inputs; no chart is a market observation, backtest or forecast. Main examples exclude dividends, trading costs, fund expenses, tax and currency conversion. Each return scenario restarts from its stated initial weights. RSP expenses and turnover are dated issuer disclosures, not a recommendation. No current constituent count or latest-year performance winner is asserted.
Keep reading.
Can public pensions remain sustainable?How to compare wages and investment returns fairly
Why do central banks buy gold?
Is China selling US debt or changing its custodian?
Gold rises, but the hedge loses
Buying at market highs: how much does time matter?
Is university worth it? What salary averages hide
A cheaper share is not a cheaper company
Who really pays a tariff?
Save €100 more or earn one percentage point more?
House prices fall. Why can buying cost more?
Invest €12,000 now or €1,000 a month?
Investing in Switzerland: francs, stocks and ETF currencies
Volume profile: support, resistance and stop-losses
Fear & Greed Index: opportunity or a warning?
What is the VIX? Calm stocks and rising bond yields
Big Tech is borrowing billions for AI. Why lenders now want more interest