THE IDEA IN ONE LINE
A record describes the past price. Your horizon affects the consequences of a fall, but historical long-run recovery is neither a deadline nor a guarantee.
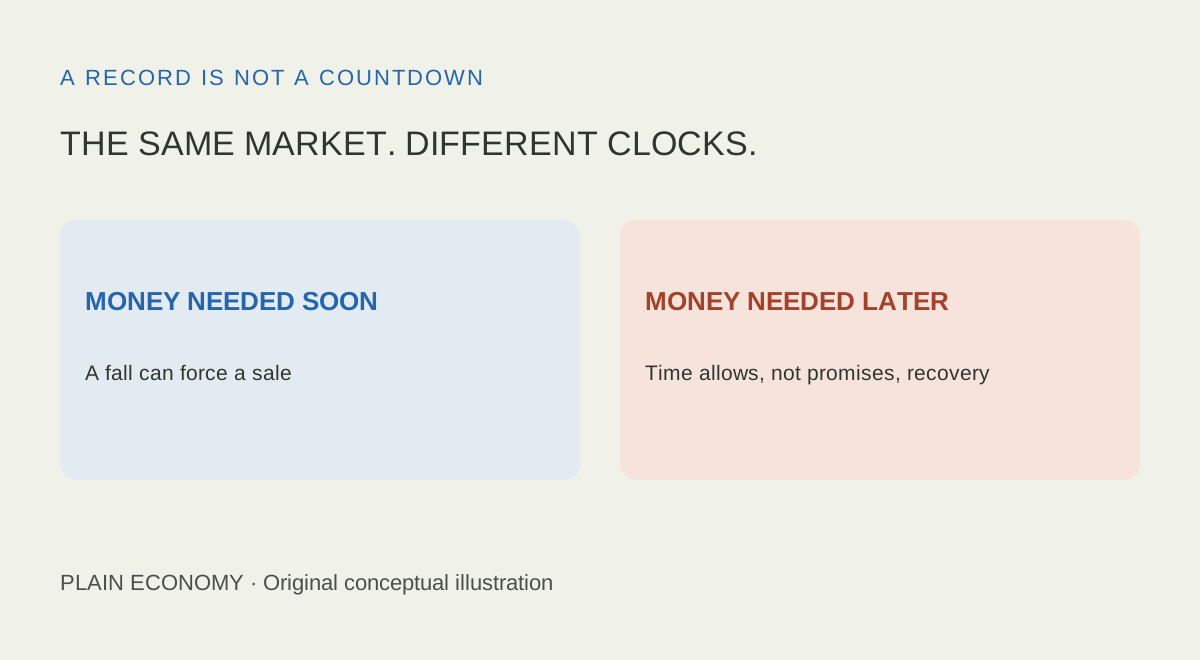
The same price. Different spending dates.
1–20 yearscomplete historical horizons
No guaranteeof future recovery
1871–2025US monthly data sample
50 / 272negative ten-year record-entry windows
1 / 247negative twenty-year record-entry windows
−45.7%worst ten-year record-entry real total return
Buying at a record price does not tell you whether the next move will be up or down; the date when you need the money changes how damaging a fall could be. A house deposit needed in two years and retirement spending decades away face different consequences from the same market decline. A longer horizon leaves more time for gains to offset losses. It does not create those gains, prevent a forced sale or make every investment recover. Historical evidence helps frame that distinction without turning a past pattern into a promise.
A record compares today's price with yesterday's history
A new high means the price exceeds earlier observed prices under a specified definition. It does not compare the price with future company earnings, cash flows or a fair value. A growing market can make repeated records. The highest price so far is therefore different from the final peak visible only afterwards. Neither label alone establishes that shares are cheap or expensive.
Our original study uses Robert Shiller's long US composite dataset. A record here means a nominal monthly-average price strictly above every preceding observed month since January 1871. It is not the highest daily closing price or an executable purchase quotation. The modern S&P 500 launched in 1957; calling the entire early composite an ETF or a live S&P 500 track record would be inaccurate.
We fix the endpoint at December 2025 and exclude all 2026 observations. Returns include an approximation to dividend reinvestment, then adjust for US consumer-price inflation. A negative result means less endpoint purchasing power than at entry. It differs from a price-only fall and from a nominal account balance. No fees, taxes, fund tracking differences or currency conversion are included.
The historical loss share changed with the holding period
For each entry month we calculate one-, five-, ten- and twenty-year returns only when the entire holding period is available. Recent records without twenty subsequent years are excluded from that twenty-year sample, not counted as successes. The first observed month is excluded because it has no earlier history against which to establish a record.
Longer complete windows had fewer negative endpoints
Share ending below initial purchasing power, %. Record = record-price entry; All = every eligible month. Counts are in the table. Zero baseline.
- Record entries
- All monthly entries
See the data
| Horizon | Entry group | Negative windows | Complete windows | Negative share |
|---|---|---|---|---|
| 1 years | Record entries | 98 | 321 | 30.5% |
| 1 years | All months | 564 | 1847 | 30.5% |
| 5 years | Record entries | 78 | 299 | 26.1% |
| 5 years | All months | 337 | 1799 | 18.7% |
| 10 years | Record entries | 50 | 272 | 18.4% |
| 10 years | All months | 193 | 1739 | 11.1% |
| 20 years | Record entries | 1 | 247 | 0.4% |
| 20 years | All months | 1 | 1619 | 0.1% |
Among 321 complete one-year record-entry windows, 98 ended with a real loss: 30.5%. The corresponding five-year count is 78 of 299, or 26.1%; ten years gives 50 of 272, or 18.4%. Twenty years gives one of 247, or 0.4%. These are descriptive shares of overlapping historical windows, not estimates of the probability that your next purchase loses money.
All monthly entries provide context, including the record months themselves. They are not a separate control group. At five and ten years, their negative shares were lower than those of record entries in this sample. Entry dates and available endpoint cohorts differ across horizons. Repeated monthly windows share much of the same market path, so treating them as thousands of independent experiments would exaggerate the evidence.
A narrower annualized range still includes painful outcomes
Annualized return expresses a multi-year change as an equivalent compounded yearly rate. It does not mean the investment actually delivered that amount every year. For record entries, the median was 9.3% real over one year, 7.5% annualized over five, 6.8% over ten and 4.7% over twenty. The long-horizon medians do not demonstrate that buying highs wins: the twenty-year all-month median was 6.8%.
A longer horizon did not make record entries outperform
Median annualized real total return, % per year. The table also gives minima and maxima. Zero baseline; annualized, not cumulative.
- Record entries
- All monthly entries
See the data
| Horizon | Entry group | Windows | Minimum | Median | Maximum |
|---|---|---|---|---|---|
| 1 years | Record entries | 321 | -38.0% | +9.3% | +53.0% |
| 1 years | All months | 1847 | -58.1% | +8.8% | +151.3% |
| 5 years | Record entries | 299 | -13.2% | +7.5% | +23.1% |
| 5 years | All months | 1799 | -13.2% | +7.4% | +33.3% |
| 10 years | Record entries | 272 | -5.9% | +6.8% | +14.8% |
| 10 years | All months | 1739 | -5.9% | +7.0% | +20.0% |
| 20 years | Record entries | 247 | -0.2% | +4.7% | +12.8% |
| 20 years | All months | 1619 | -0.2% | +6.8% | +13.6% |
The range of annualized outcomes narrowed at longer horizons in this dataset, but this does not guarantee smaller possible cash losses or a comfortable journey. The worst ten-year record-entry window, March 1999 to March 2009, lost 45.7% of purchasing power cumulatively, equivalent to −5.9% a year. Its nominal total return was approximately −30.0%. Mixing that cumulative loss with the annualized rate would confuse two different measurements.
Even the twenty-year sample contained a negative real outcome: June 1901 to June 1921. Its nominal cumulative gain of 124.0% became a 4.3% purchasing-power loss, or roughly −0.2% annualized, after inflation. This is reconstructed early history, not a precisely replicable retail trade or a future floor. It is enough to rule out the claim that twenty years made every observed window safe under this method.
The endpoint cannot show whether you could stay invested
A positive final return hides any fall along the way. Suppose a hypothetical holding drops from 100 to 50. A subsequent 50% gain reaches 75, not 100; full recovery requires a 100% gain from the smaller base. There is no time estimate in that arithmetic. A calendar cannot repair a loss without sufficient subsequent returns. Adding new savings can increase an account balance without recovering the original investment's return.
A 50% loss needs a 100% gain to recover
Hypothetical holding value in units, not market history. No contributions or withdrawals; zero baseline.
See the data
| Stage | Calculation | Value units |
|---|---|---|
| Start | Initial value | 100 |
| Loss | 100 × 0.5 | 50 |
| Partial recovery from 50 | 50 × 1.5 | 75 |
| Full recovery from 50 | 50 × 2 | 100 |
Investor.gov cautions that money needed for goals five years or less away can expose an investor to selling risky assets at a loss. This is a warning about the spending date, not a rule that six years is automatically safe. Unexpected expenses or repayment commitments can shorten an intended horizon. The practical question is whether the person can absorb a bad outcome without being forced to sell.
SEC investor education links asset allocation to time horizon and both the ability and willingness to bear losses. Diversification across holdings and assets matters too. Our composite history is not evidence for one company: common shareholders can receive nothing in a bankruptcy. Waiting longer cannot ensure that a failed business comes back.
A useful decision starts with the spending need
This is one surviving national market, not a universal history of every country. A euro-based reader also faces exchange rates and a different spending basket: US CPI-adjusted returns do not measure purchasing power in their euro account. The monthly-average and interpolated-dividend methods are educational approximations, not an implementable timing system. They cannot tell us what today's market will do.
Separate three questions: is the price a record, what supports its valuation, and when must the money be available? Then consider flexibility, diversification, costs and the size of a loss you could withstand. A long horizon changes the room available for recovery. It does not remove the need to plan for losses, and a record price supplies neither an instruction to buy nor a reason by itself to stay out.
Optional: reproduce the historical method
For each month t after the first, nominal total-return index TR[t] = TR[t−1] × (P[t] + D[t]/12) / P[t−1]. D is the annual dividend figure; one twelfth is assumed paid over the interval and reinvested at the ending monthly-average price. This uses interpolated data retrospectively, not actual ex-dividend cash flows. Divide TR by CPI relative to the first month for a real index. For h years, real cumulative ratio R = realTR[t+12h]/realTR[t]; cumulative return = 100 × (R−1), annualized return = 100 × (R^(1/h)−1). Strict records use nominal P and all preceding months. First-month entries and incomplete windows are excluded. Last eligible starts are December 2024, 2020, 2015 and 2005 for the respective horizons. Download the monthly calculation inputs (CSV) and results summary (JSON) to reproduce and check the figures offline. The original workbook and data documentation are available from Robert Shiller's data page.
Sources and method
- Robert Shiller: US monthly price, dividend and CPI data and documentation
- S&P Dow Jones Indices: Index history
- SEC Investor.gov: Asset allocation
- SEC Investor.gov: Gauge your risk tolerance
- SEC Investor.gov: Stocks
Checked 16 October 2026. Data cutoff December 2025. US monthly-average composite, approximate dividends, US CPI; no confidence interval, causal result or future loss probability. Historical calculations and hypothetical recovery bars are separate.
Keep reading.
How to compare wages and investment returns fairlyWhy do central banks buy gold?
Is China selling US debt or changing its custodian?
Gold rises, but the hedge loses
Is university worth it? What salary averages hide
A cheaper share is not a cheaper company
Who really pays a tariff?
Save €100 more or earn one percentage point more?
House prices fall. Why can buying cost more?
Invest €12,000 now or €1,000 a month?
Investing in Switzerland: francs, stocks and ETF currencies
Volume profile: support, resistance and stop-losses
Fear & Greed Index: opportunity or a warning?
What is the VIX? Calm stocks and rising bond yields
Big Tech is borrowing billions for AI. Why lenders now want more interest