THE IDEA IN ONE LINE
Staging an investment changes when your money takes market risk; it does not guarantee a lower cost or a profit.
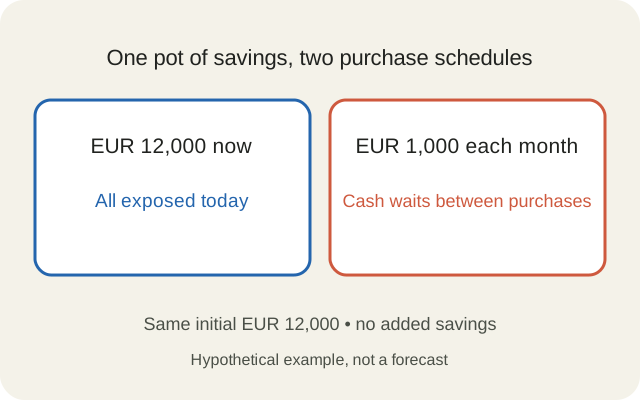
The money is ready. The price path is unknown.
12,000euros available at the start
12equal purchases in the staged example
12,000same initial euros in both schedules
1,000euros per monthly purchase
11,000euros initially left in cash by staging
12purchase dates, with no extra contributions
Investing EUR 12,000 immediately exposes all of it to the market today. Investing EUR 1,000 a month leaves some cash waiting and changes the prices at which you buy. Neither schedule guarantees the better result. An early rise favours money already invested; an early fall lets later instalments buy more units. The decision also depends on what you own, when you need the money and whether you can follow the plan through losses. A purchase timetable cannot make an unsuitable investment suitable.
Compare the same money before comparing returns
Our starting point is precise: you already have EUR 12,000 available. One schedule invests it all at the beginning of month one. The other invests EUR 1,000 at the beginning of each of twelve months. Both finish at the end of month twelve, and neither receives extra money. The staged plan starts with EUR 1,000 invested and EUR 11,000 in cash. That cash belongs in the comparison even while it is waiting.
Saving EUR 1,000 from each future paycheque is a different question. Money you have not yet earned cannot normally be invested today without borrowing. FINRA explicitly distinguishes investing available savings gradually from investing income as it arrives. Confusing the two makes routine monthly saving appear to be a deliberate decision to delay an available lump sum.
A monthly plan initially leaves EUR 11,000 in cash
Hypothetical amounts committed after each scheduled purchase; these are cash allocations, not market values.
See the data
| Month | Immediate deployed | Monthly deployed | Monthly cash |
|---|---|---|---|
| 1 | 12,000 | 1,000 | 11,000 |
| 2 | 12,000 | 2,000 | 10,000 |
| 3 | 12,000 | 3,000 | 9,000 |
| 4 | 12,000 | 4,000 | 8,000 |
| 5 | 12,000 | 5,000 | 7,000 |
| 6 | 12,000 | 6,000 | 6,000 |
| 7 | 12,000 | 7,000 | 5,000 |
| 8 | 12,000 | 8,000 | 4,000 |
| 9 | 12,000 | 9,000 | 3,000 |
| 10 | 12,000 | 10,000 | 2,000 |
| 11 | 12,000 | 11,000 | 1,000 |
| 12 | 12,000 | 12,000 | 0 |
Before scheduling purchases, separate money needed for near-term expenses and unexpected bills. Investor.gov explains that emergency savings can help avoid expensive borrowing and that returns cannot be guaranteed to exceed costly debt. The relevant amount is savings available for the chosen investment purpose, rather than every euro visible in a bank account.
Fixed cash buys more units when the price is lower
Dollar-cost averaging means investing equal cash amounts at regular intervals, regardless of market movements. The name also applies when the cash is euros. At EUR 100 per unit, EUR 1,000 buys ten units. At EUR 80 it buys 12.5. You do not need to predict the low for this arithmetic to work, but buying more units is not the same as guaranteeing that those units will later recover.
We use three deliberately simple price paths, all beginning at EUR 100. One rises steadily, one falls steadily, and one falls before recovering. A month-one purchase takes place immediately, followed by purchases at the start of months two through twelve. We value everything at month twelve's ending price, assumed unchanged after its final purchase. The chart's month numbers describe a sequence, not a forecast for any particular year.
Purchase prices determine how many units each instalment buys
Invented EUR prices: blue = rising; coral = falling; grey = dip and recovery. Month numbers are relative, not calendar dates.
See the data
| Month | Rising | Falling | Dip / recovery |
|---|---|---|---|
| 1 | 100 | 100 | 100 |
| 2 | 102 | 98 | 95 |
| 3 | 104 | 96 | 90 |
| 4 | 106 | 94 | 85 |
| 5 | 108 | 92 | 80 |
| 6 | 110 | 90 | 75 |
| 7 | 112 | 88 | 80 |
| 8 | 114 | 86 | 85 |
| 9 | 116 | 84 | 90 |
| 10 | 118 | 82 | 95 |
| 11 | 120 | 80 | 100 |
| 12 | 122 | 78 | 105 |
Fractional units are allowed. The examples exclude dividends, fees, spreads, taxes, cash interest, inflation and currency changes. Zero interest on waiting cash is a simplifying assumption, not a claim about current bank rates. It isolates the purchase-price mechanism. A real comparison must credit the return actually earned on cash and subtract the costs actually paid.
The route to the final price matters
In the rising path, investing immediately buys 120 units at EUR 100. At the final EUR 122 price, these are worth EUR 14,640. The monthly plan buys progressively fewer units as the same EUR 1,000 meets higher prices. Its final value is EUR 13,240.57. Staging did not cause a loss here; it left part of the money out of a rising market and earned less.
In the falling path, the final EUR 78 price reduces the immediate investment to EUR 9,360. Monthly purchases buy more units later and finish at EUR 10,580.83. The staged plan does better relative to the alternative but still loses EUR 1,419.17 against its original savings. A lower average purchase cost is useful only in relation to the eventual value of what you bought. As CIRO stresses, averaging does not prevent losses or guarantee a return.
The same EUR 12,000 can produce different winners
Hypothetical end-of-month-12 account values, EUR; whole-euro bars, cents in the table. Zero baseline.
See the data
| Path | Immediate ending EUR | Monthly ending EUR |
|---|---|---|
| Rising | 14,640.00 | 13,240.57 |
| Falling | 9,360.00 | 10,580.83 |
| Dip / recovery | 12,600.00 | 14,139.45 |
The dip-and-recovery path ends at EUR 105. Immediate investment reaches EUR 12,600, while monthly purchases reach EUR 14,139.45 because several instalments bought below the starting price. The same final price with a different intermediate path could produce a different staged result. These are chosen examples, so two wins for staging out of three charts do not mean a two-thirds real-world chance of success.
How the examples are calculated
Immediate units = 12,000 / 100 = 120. Monthly units = the sum of 1,000 divided by the purchase price at each of the twelve dates. Final value = total units × the terminal price. Calculations retain unrounded fractional units; only displayed money is rounded. If charting account wealth before all purchases, include remaining cash: investment value alone is not total wealth.
Historical evidence supports a tendency, not a promise
Vanguard's 2023 study found immediate investment ahead in 68% of rolling one-year comparisons using MSCI World returns over 1976–2022. That comparison put all money into equities immediately versus three equal purchases one month apart, with no interest on waiting cash. Adding a US Treasury-bill cash proxy reduced the reported frequency to 65%. These are the investment provider's historical results, not probabilities for a euro investor today. The study's three-purchase design also differs from our twelve-purchase illustrations; index performance does not equal a fund's net return.
The economic trade-off is straightforward: committing earlier gives an asset more time to earn its return, including a negative return. Holding cash temporarily reduces exposure to both early gains and early losses. History can inform the discussion, but it cannot reveal the next twelve purchase prices. A claim that one schedule always wins is inconsistent with both the examples and the research.
Choose the exposure before the timetable
Investor.gov links asset allocation to time horizon and willingness and ability to bear losses. Diversification spreads exposure; a narrowly focused fund is not necessarily diversified simply because it is a fund. The appropriate mix of assets is a separate question from how rapidly to enter it. After the final purchase, a staged plan is fully exposed to subsequent movements in its chosen holdings.
A fixed schedule can reduce the temptation to make every purchase depend on a headline, as FINRA discusses. It can also become open-ended market timing if each instalment is cancelled whenever prices look uncomfortable. The relevant behavioural question is whether the schedule makes a workable plan easier to follow. It is not evidence that a monthly purchase protects the next instalment from a fall.
Finally, compare cash yield, dealing charges, spreads, fund expenses, currency conversion and applicable taxes on consistent terms. Twelve purchases can cost more than one where each transaction carries a fee. A written plan should state the amount, dates, asset exposure and circumstances that justify a genuine reassessment. The useful outcome is a clear commitment matched to the purpose of the money, rather than a promise to find the perfect entry price.
Sources and method
- Investor.gov: Dollar-cost averaging
- FINRA: Dollar-cost averaging, benefits and limitations
- Investor.gov: Build wealth through saving and investing
- Investor.gov: Asset allocation and diversification
- CIRO: Dollar-cost averaging
- Vanguard: Cost averaging, invest now or temporarily hold your cash? (2023)
Sources checked 16 October 2026. Charts use original hypothetical arithmetic with identical initial savings, twelve beginning-of-month purchases and a common final date. No future-return probabilities, current market quotes or specific products are supplied.
Keep reading.
House prices fall. Why can buying cost more?Investing in Switzerland: francs, stocks and ETF currencies
Volume profile: support, resistance and stop-losses
Fear & Greed Index: opportunity or a warning?
What is the VIX? Calm stocks and rising bond yields
Big Tech is borrowing billions for AI. Why lenders now want more interest