THE IDEA IN ONE LINE
Pension sustainability depends on money collected, benefits promised and other financing. It must be considered alongside whether payments provide adequate income.
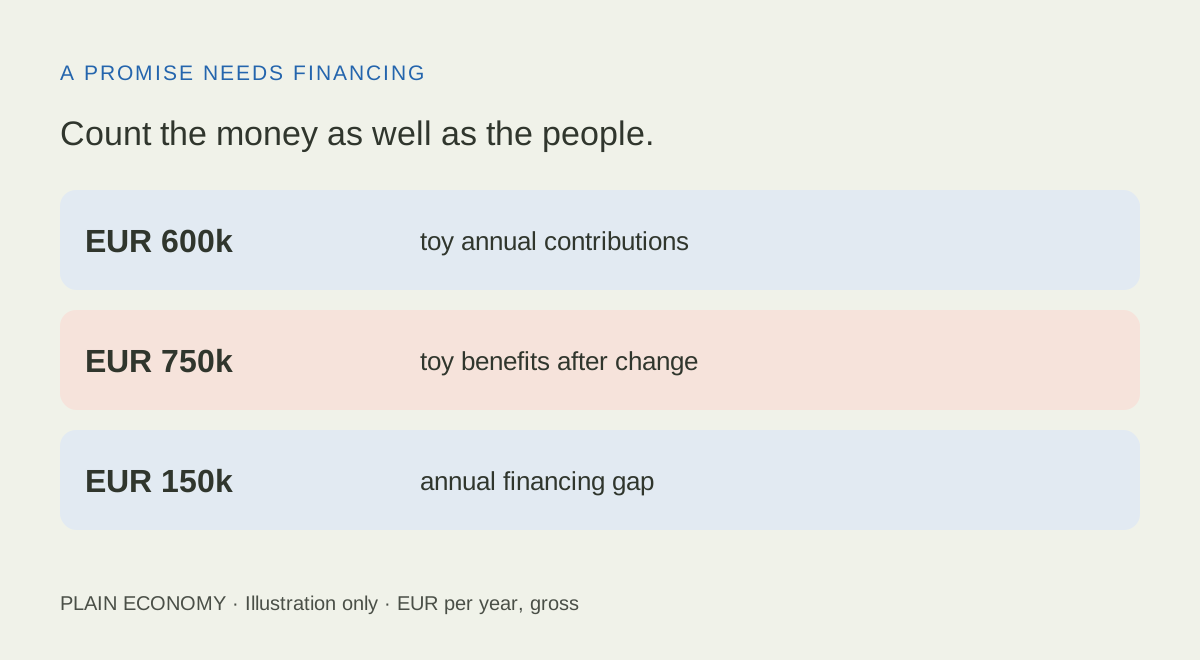
Count the money as well as the people.
EUR 600ktoy annual contributions
EUR 750kbenefits with more recipients
EUR 150kannual financing gap
EUR 600ktoy annual contributions
EUR 750ktoy benefits after change
3.4 ppSpain scenario increase, % GDP
Imagine a shared household account: money arrives during the year, and bills must be paid from it. More bills create pressure, but counting the people around the table does not tell you how much they earn or contribute. Public pension sustainability is a question about financing promises over time. Ageing matters; so do employment, covered pay, benefit rules and other public resources. A projection of rising costs identifies choices, rather than a date when pensions inevitably disappear.
Today's payments can come from today's revenues
In a pay-as-you-go arrangement, current contributions and other revenues finance current benefits. The OECD distinguishes this from asset-backed arrangements that accumulate retirement assets. Public schemes can hold reserves, and public or private administration is a separate distinction from how benefits are financed. A record of pension rights need not be a personal investment pot containing matching assets.
A useful starting calculation is annual contributors times covered earnings times the effective contribution rate. Compare that with recipients times their average annual total benefit. Keep the units consistent: a working-age resident is not necessarily employed, covered or contributing throughout the year. The ILO's actuarial manual separates registered people, active contributors and recipients. Its definitions explain the accounting; this older manual supplies no current Spanish statistics.
Nor is a pension the same unit as a person. Spain's September 2026 release reports 10,547,417 contributory Social Security pensions paid to more than 9.5 million people. One recipient can receive multiple pensions. These monthly figures cover contributory Social Security benefits, including disability and survivors' pensions, and are not an annual total for every Spanish pension arrangement.
A simple budget makes the financing choices visible
Consider an invented scheme with 100 full-year contributors earning EUR 30,000 each and paying a combined 20% contribution. This is a teaching rate, not Spain's rate. Annual contributions equal EUR 600,000. Forty recipients each receiving EUR 15,000 cost the same amount. Assume one pension per person, complete collection and no other costs or financing.
More recipients open a EUR 150,000 annual gap
Original illustration, EUR thousands per year. Gross amounts in constant purchasing power; zero baseline.
See the data
| Annual state | Contributors | Gross pay EUR/year each | Toy rate | Recipients | Gross benefit EUR/year each | Contributions EUR/year | Benefits EUR/year | Gap EUR/year |
|---|---|---|---|---|---|---|---|---|
| Starting budget | 100 | 30,000 | 20% | 40 | 15,000 | 600,000 | 600,000 | 0 |
| More recipients | 100 | 30,000 | 20% | 50 | 15,000 | 600,000 | 750,000 | 150,000 |
If only the number of recipients rises to 50, spending becomes EUR 750,000 while contributions stay at EUR 600,000. The gap is EUR 150,000 per year. The following alternatives each close it on paper with all other inputs fixed. They are arithmetic comparisons, not a menu of equally feasible reforms.
See the data
| One change at a time | Required value | Annual check |
|---|---|---|
| More contributors | 125 people | 125 × EUR 30,000 × 20% = EUR 750,000 |
| Higher covered pay | EUR 37,500 each | 100 × EUR 37,500 × 20% = EUR 750,000 |
| Higher contribution rate | 25% | 100 × EUR 30,000 × 25% = EUR 750,000 |
| Lower gross benefit | EUR 12,000 each | 50 × EUR 12,000 = EUR 600,000 |
| Transfer funded elsewhere | EUR 150,000 | EUR 600,000 + EUR 150,000 = EUR 750,000 |
Every option has consequences outside this small account. Extra workers can earn future pension rights. Higher pay can raise future benefits when rules link them to earnings. Higher contribution rates affect take-home pay and labour costs. Lower benefits change living standards. A government transfer requires resources elsewhere: taxes, less room for other services, asset use or borrowing. Moving money between public accounts does not create resources for government as a whole.
Fewer contributors do not automatically mean less money
Now compare two separate annual states, measured in constant-purchasing-power euros. Starting from the balanced budget, let contributors fall to 90 while covered pay rises to EUR 36,000. At the same 20% rate, revenue rises to EUR 648,000. With 45 recipients each receiving EUR 15,750, spending reaches EUR 708,750.
A lower support ratio can coexist with higher revenue
Original illustration, EUR thousands per year. Ratios: 2.5 contributors per recipient in A; 2.0 in B. Zero baseline.
See the data
| Annual state | Contributors | Gross pay EUR/year each | Toy rate | Recipients | Gross benefit EUR/year each | Contributions EUR/year | Benefits EUR/year | Gap EUR/year |
|---|---|---|---|---|---|---|---|---|
| Starting budget | 100 | 30,000 | 20% | 40 | 15,000 | 600,000 | 600,000 | 0 |
| B: higher real pay | 90 | 36,000 | 20% | 45 | 15,750 | 648,000 | 708,750 | 60,750 |
The contributors-per-recipient ratio falls from 2.5 to 2.0, yet revenue rises 8%. Spending rises faster, leaving EUR 60,750 unfunded. A population ratio alone would miss both changes. This example proves neither that productivity always solves ageing nor that a lower ratio guarantees collapse.
The European Commission's Ageing Report separates demographic, coverage, benefit and labour-market effects. More formal employment can broaden contributions; productivity helps when it reaches covered earnings or other tax bases. Later retirement can add contribution years and shorten payment years, depending on jobs, health and eligibility. Migration can add workers and taxpayers, alongside public-service needs and future pension rights. None is a costless switch.
Spain's projections describe pressure, not a disappearance date
For a concrete country example, AIReF's 29 May 2026 exercise puts Spain's gross public pension spending at 13.0% of GDP in its 2025 baseline, 13.5% in 2030 and 16.4% in 2050. The future points are conditional projections. The scope includes contributory Social Security, non-contributory and civil-service Clases Pasivas pensions, broader than the monthly payroll cited earlier.
Spain: projected spending rises relative to economic output
Gross public pension spending, % of GDP. AIReF May 2026 exercise: baseline and conditional projections, zero baseline.
See the data
| Year | Gross spending % GDP | Status |
|---|---|---|
| 2025 | 13.0 | Baseline in May 2026 exercise |
| 2030 | 13.5 | Conditional projection |
| 2050 | 16.4 | Conditional projection |
The baseline-to-2050 increase is 3.4 percentage points of GDP, not a 3.4% rise in individual pensions. Think of spending equivalent to EUR 13 out of every EUR 100 of annual output becoming EUR 16.40 under these assumptions. GDP is the economy's output, not the government's tax receipts. The chart also differs from the legally defined average net expenditure-rule indicator; that indicator's 13.0% is not this annual gross baseline merely because the numbers match.
AIReF's exercise depends on employment, productivity, demographic and policy assumptions. Meeting an expenditure rule does not itself establish long-term sustainability. Reserves can bridge a shortfall, but drawing them down does not permanently close a recurring gap. Borrowing supplies financing today and creates obligations tomorrow.
The ILO distinguishes sustainable finance from adequate income security. A budget can balance while leaving older people poor. A generous promise can require a financing change. A useful reform discussion therefore asks two questions together: can the finances support the promises, and will the payments support people? The answer needs distributional detail as well as totals.
Optional: reproduce the annual arithmetic
Contributions = contributors × annual covered gross pay × rate. Benefits = recipients × average annual total gross benefit. Starting budget: 100 × 30,000 × 0.20 = 40 × 15,000 = 600,000. More recipients: 50 × 15,000 − 600,000 = 150,000. Second state: 90 × 36,000 × 0.20 = 648,000; 45 × 15,750 = 708,750; gap = 60,750. All toy amounts are annual constant-price euros before personal taxes. Administration, investment income, transfers, reserves and borrowing are initially zero. Real schemes require those items and behavioural feedbacks. Spain's change is 16.4 − 13.0 = 3.4 percentage points of GDP.
Sources and method
- OECD: features of asset-backed pension systems
- ILO: actuarial pension modelling manual
- ILO: pensions and income security
- European Commission: 2024 Ageing Report
- Spain: September 2026 contributory pension release
- AIReF: pension expenditure rule study, 29 May 2026, pp. 14–16 and 53
- AIReF: May 2026 presentation, gross spending scenario
Sources checked 17 October 2026. Original examples simplify actuarial relationships and are not forecasts or individual pension advice. Spain figures use AIReF's single May 2026 exercise; 2025 is its baseline, not an independently audited outturn. Annual gross spending scope is consistent across the three points. The September ministry release is used only to distinguish pension counts from recipients, without annualising its payroll.
Keep reading.
S&P 500 versus equal weight: what changes?How to compare wages and investment returns fairly
Why do central banks buy gold?
Is China selling US debt or changing its custodian?
Gold rises, but the hedge loses
Buying at market highs: how much does time matter?
Is university worth it? What salary averages hide
A cheaper share is not a cheaper company
Who really pays a tariff?
Save €100 more or earn one percentage point more?
House prices fall. Why can buying cost more?
Invest €12,000 now or €1,000 a month?
Investing in Switzerland: francs, stocks and ETF currencies
Volume profile: support, resistance and stop-losses
Fear & Greed Index: opportunity or a warning?
What is the VIX? Calm stocks and rising bond yields
Big Tech is borrowing billions for AI. Why lenders now want more interest