THE IDEA IN ONE LINE
Higher graduate earnings are useful evidence, but a specific degree's value depends on costs, completion, alternatives and outcomes that a group average cannot predict.
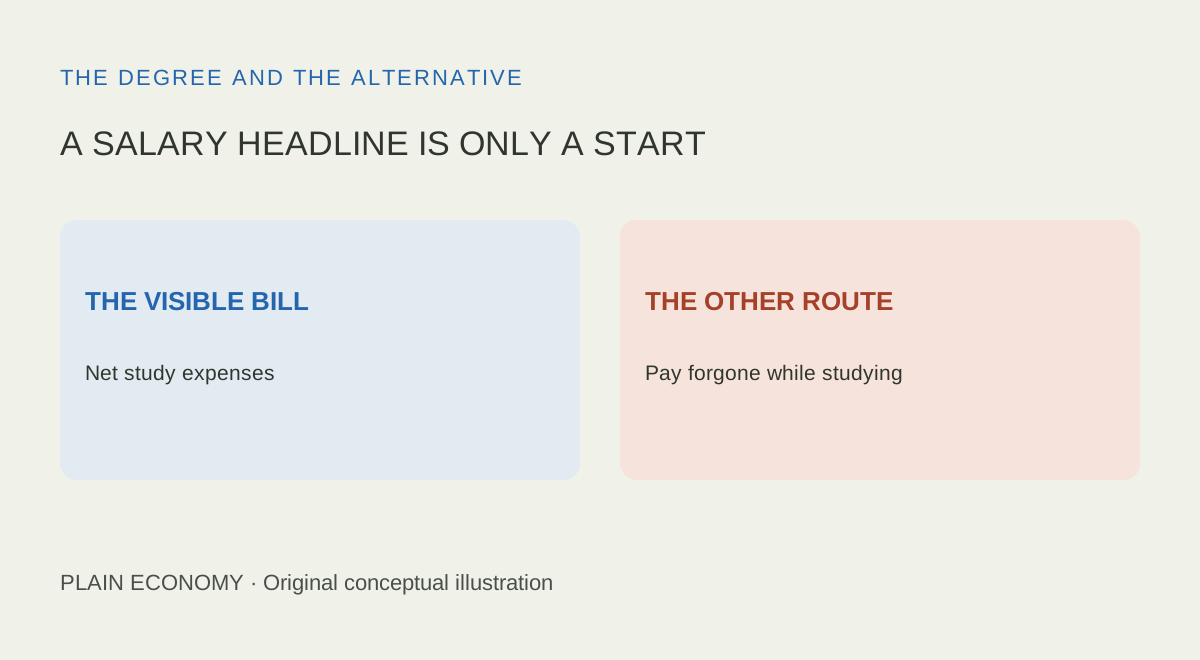
A salary headline is not a personal return.
EUR 84,000invented total cost
7–28 yearsscenario payback after graduation
USD 1,578US bachelor's weekly median
USD 966US high-school weekly median
EUR 84,000hypothetical four-year cost
14 yearspayback with EUR 6,000 net premium
A degree can improve earning prospects, but a headline saying graduates earn more cannot tell you whether a particular course is worth its cost. Imagine comparing two routes to the same destination. The faster-looking route still needs a fare, a realistic arrival time and an alternative to compare it with. For university, those are net study expenses, time without earnings and the work or training you would otherwise do. The decision also has personal and social value beyond a payslip.
The middle salary is not the salary of the typical new entrant
People often call every summary an average. A mean adds everyone's earnings and divides by the number of people; a few very high earners can lift it sharply. A median is the middle observation when earnings are ordered. Neither shows the full spread. Two courses with the same median can have very different low outcomes, employment patterns or regional opportunities.
BLS reports US median weekly earnings by completed educational attainment. In its 2025 figures, bachelor's graduates earned USD 1,578 against USD 966 for high-school graduates, within the defined earnings sample. The difference is USD 612, about 63.4% of the high-school figure. That is our subtraction between observed groups, not the extra income a given person would cause by enrolling.
A higher median describes a group, not your future pay
US median usual weekly gross earnings, 2025, USD. Full-time wage and salary workers aged 25 and over. Zero baseline.
See the data
| Highest completed education | Median weekly gross earnings USD | Unemployment rate % |
|---|---|---|
| High school diploma | 966 | 4.3 |
| Some college, no degree | 1062 | 3.8 |
| Associate's degree | 1135 | 3 |
| Bachelor's degree | 1578 | 2.8 |
The earnings population is full-time wage and salary workers aged 25 and over. It excludes unemployed people, part-time workers and the self-employed. BLS defines full-time as usually at least 35 hours weekly and reports earnings before taxes and deductions. This is neither starting pay nor take-home pay. Multiplying the gap by 52 would not establish a guaranteed annual advantage with continuous paid employment.
The unemployment column has a different denominator: the labour force aged 25 and over. It is not limited to the earnings sample. Its 2.8% bachelor's rate is not a new student's personal unemployment probability, and subtracting it from 100 does not give the employment share of every graduate. People outside the labour force are outside that unemployment denominator.
Graduates and non-graduates differ before the course starts
New York Fed researchers caution that some measured college benefit can reflect pre-existing abilities rather than skills acquired at university. Prior preparation, family resources, geography, experience and access to occupations can differ too. An association between completed education and pay cannot isolate the causal effect of attendance. That limitation does not show that education has no effect; it tells us what this chart cannot measure.
Completed attainment also hides the journey. A comparison of graduates leaves out the full range of outcomes among people who start a programme and do not finish it. Delayed completion can mean extra expenses, more forgone pay and a later start to graduate earnings. The Fed's companion study shows how modeled returns differ with completion time and earnings outcomes. A graduate-only estimate should not become a promise to every entrant.
The course matters. Federal Reserve administrative-data research finds that field is, on average, a stronger wage predictor than institutional selectivity, while field rankings differ across institutions. This is a reason to seek programme-level evidence rather than buy a prestige label alone. It does not establish a universal ranking of subjects, nor guarantee that yesterday's labour market will persist.
Count the alternative's pay, and avoid counting a loan twice
Federal Student Aid recommends comparing net prices after grants and scholarships. A loan pays a bill now but must be repaid; it is financing rather than a discount. Ask whether aid renews, what extra transport or accommodation is required, and what work remains possible while studying. Ordinary food and rent that would exist on either route are not automatically additional education costs.
Our invented four-year example assumes EUR 6,000 per year of net incremental study expenses and EUR 15,000 per year of forgone after-tax pay relative to a realistic alternative. The first already includes all extra living costs; the second already allows for student employment. The total is EUR 24,000 plus EUR 60,000, or EUR 84,000. These are transparent assumptions, not estimates of Spanish or American course costs.
The tuition bill can be smaller than the economic cost
Hypothetical four-year course, EUR. Total is the sum of the first two bars, not a third additional cost. Zero baseline.
See the data
| Component | Calculation | EUR |
|---|---|---|
| Net incremental study costs | 4 × 6,000 | 24,000 |
| Forgone net pay | 4 × 15,000 | 60,000 |
| Total | 24,000 + 60,000 | 84,000 |
If borrowed money finances tuition already counted, adding the loan principal again would double count that expense. Financing interest and fees still matter, as do the dates of repayments. A course with a positive long-run payoff can nevertheless create a serious near-term cash shortage. Economic value and the ability to meet a monthly payment are different questions.
A payback calculation needs an assumed advantage over the alternative
Suppose the student graduates after four years and immediately earns a constant additional EUR 6,000 a year after tax compared with the alternative. Dividing EUR 84,000 by EUR 6,000 gives fourteen years after graduation, or eighteen after starting. This is simple undiscounted payback. It is not an investment yield or a salary forecast, and the premium is not the BLS gap converted into euros.
The assumed net earnings advantage changes the payback
Years after graduation to recover EUR 84,000. Hypothetical constant annual after-tax premiums; zero baseline.
See the data
| Annual net premium EUR | Years after graduation | Years after starting four-year course |
|---|---|---|
| 3,000 | 28 | 32 |
| 6,000 | 14 | 18 |
| 12,000 | 7 | 11 |
A EUR 3,000 net premium takes twenty-eight years after graduation; EUR 12,000 takes seven. With a zero or negative premium, the initial cost is never recovered in this model. We hold purchasing-power amounts consistent and exclude wage growth, career breaks and financing charges. An extra year of study would alter both the cost and the start of benefits, not merely add one year to these bars.
A fuller calculation dates each cost and benefit and discounts future amounts. OECD's education return methodology distinguishes private after-tax benefits, forgone earnings and discounted future flows. Grant support can reduce a student's private cost without erasing resources funded by others. A private financial payoff therefore differs from a social return, and both differ from satisfaction, knowledge or access to a desired profession.
The useful next question is specific: what does this programme cost me compared with a credible alternative, and what happens if completion takes longer or earnings disappoint? Look for local, current outcome definitions and distinguish entrants from graduates. Fit, capacity to finish and financial flexibility belong alongside pay. A salary headline can open that investigation; it cannot complete it.
Optional: reproduce the scenario arithmetic
Cost = 4 × EUR 6,000 + 4 × EUR 15,000 = EUR 84,000. Simple payback after graduation = cost / annual incremental net earnings: 84,000/3,000 = 28; 84,000/6,000 = 14; 84,000/12,000 = 7. Add four years to locate those dates from enrolment. No uncertainty or discounted present value is estimated.
Sources and method
- BLS: Education pays, 2025 (September 2026)
- BLS: Current Population Survey definitions
- New York Fed: Is college still worth it? (April 2025)
- New York Fed: When college might not be worth it (April 2025)
- Federal Student Aid: Evaluating financial aid offers
- Federal Reserve FEDS 2024-018: Institution, major, and firm-specific premia
- OECD: Education at a Glance 2025, earnings advantages and return methodology
Checked 16 October 2026. US group statistics are not a Spain-specific forecast or a causal estimate. Euro charts are original assumptions; no individual course, admission chance or personal return is assessed.
Keep reading.
How to compare wages and investment returns fairlyWhy do central banks buy gold?
Is China selling US debt or changing its custodian?
Gold rises, but the hedge loses
Buying at market highs: how much does time matter?
A cheaper share is not a cheaper company
Who really pays a tariff?
Save €100 more or earn one percentage point more?
House prices fall. Why can buying cost more?
Invest €12,000 now or €1,000 a month?
Investing in Switzerland: francs, stocks and ETF currencies
Volume profile: support, resistance and stop-losses
Fear & Greed Index: opportunity or a warning?
What is the VIX? Calm stocks and rising bond yields
Big Tech is borrowing billions for AI. Why lenders now want more interest