THE IDEA IN ONE LINE
Extra saving adds your own money; an extra percentage point works on invested money. Their relative effect depends on capital, time and actual returns.
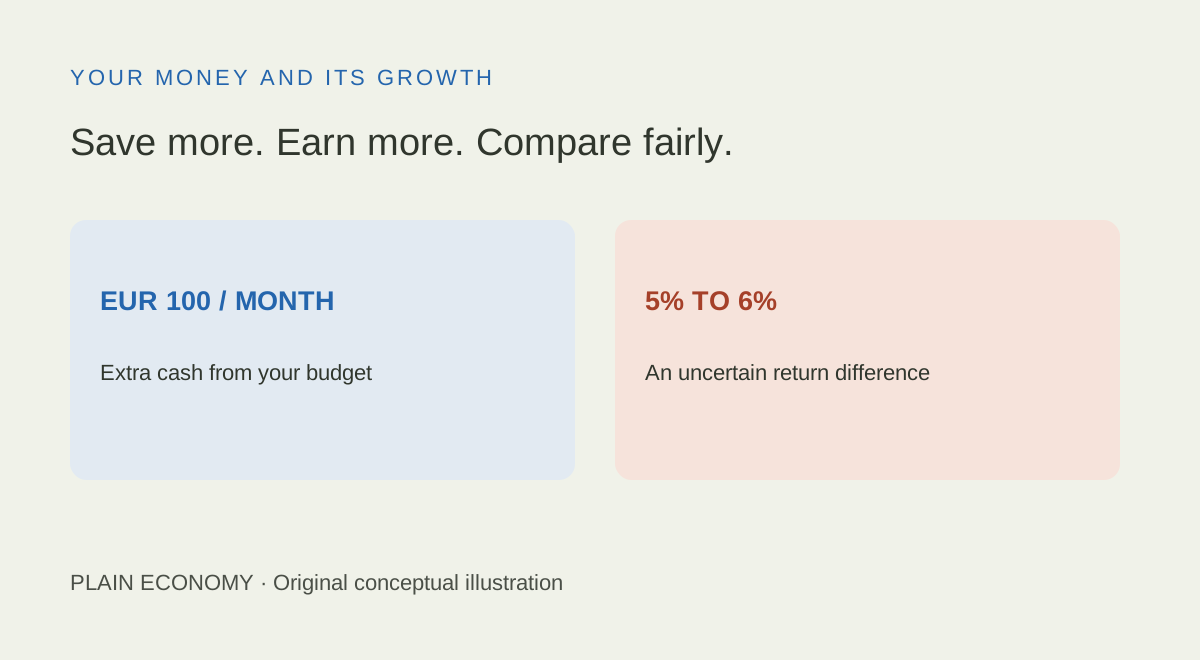
A larger balance can come from two different places.
100extra euros each month
1 pointfrom an illustrative 5% to 6%
100extra euros paid in each month
1,200extra euros paid in each year
5% → 6%one percentage point, not one percent
20years in the composition example
For a small portfolio, an extra EUR 100 a month can add much more to future wealth than a hypothetical extra percentage point of return. For a large portfolio, the return difference can become the bigger number. Neither comparison makes the extra return dependable or the extra saving affordable. One choice asks you to give up more spending today; the other assumes a different investment outcome. Understanding that distinction is more useful than declaring a universal winner.
One percentage point and EUR 100 do different jobs
Moving from 5% to 6% means adding one percentage point to the annual rate. Increasing 5% by 1% instead produces 5.05%. The move to 6% is a 20% relative increase in the rate itself, but it does not make your portfolio instantly worth 20% more. The additional return acts on the balance invested and builds over time.
Adding EUR 100 each month is new cash. Over one year, you put in EUR 1,200 more; over twenty years, EUR 24,000 more. Any gain subsequently earned on that extra cash belongs to investment performance, but the cash itself does not. Investor.gov defines compound interest as interest earned on capital and previously accumulated interest. The same compounding idea underlies our smooth return examples, without implying that markets deliver smooth interest.
Start with a common baseline
Our baseline invests EUR 200 at the end of each month at a constant 5% effective annual return. The saving alternative raises that contribution to EUR 300 and keeps 5%. The return alternative keeps EUR 200 and assumes 6%. Each comparison uses identical starting capital and an identical ending date. The annual rates are invented, before fees, taxes and inflation, with all proceeds reinvested and no withdrawals.
The SEC's compound-interest calculator separates initial investment, monthly contributions, time and assumed return. These are also separate inputs here. We convert each annual rate consistently into its monthly equivalent rather than simply dividing by twelve. Constant returns remove volatility to isolate the arithmetic. Actual market paths, especially with regular contributions, can change the outcome.
After one year, the starting balance changes the comparison
Extra ending wealth versus EUR 200/month at 5%. Saving = EUR 300/month at 5%; return = EUR 200/month at 6%. Hypothetical EUR, zero baseline.
See the data
| Initial EUR | Extra saving benefit | Extra return benefit | Extra cash contributed: saving |
|---|---|---|---|
| 0 | 1,227.26 | 10.79 | 1,200 |
| 10,000 | 1,227.26 | 110.79 | 1,200 |
| 100,000 | 1,227.26 | 1,010.79 | 1,200 |
| 500,000 | 1,227.26 | 5,010.79 | 1,200 |
With EUR 10,000 initially, the saving alternative adds EUR 1,227.26 to first-year ending wealth relative to the baseline. Of that, EUR 1,200 is your extra contributions. The higher-return alternative adds EUR 110.79 without extra contributions. At EUR 500,000 initially, the assumed return improvement adds EUR 5,010.79 instead. The same extra saving still adds EUR 1,227.26 because its size and timing have not changed.
Capital and time change the balance
Over ten years, extra monthly saving adds EUR 15,436.32 to ending wealth in each starting-capital case. At EUR 10,000 initially, the higher-return alternative adds about EUR 3,242. At EUR 100,000, it adds about EUR 17,817 and exceeds the saving alternative. Those differences come from the model, not a rule about when people should take more investment risk.
After 10 years, the starting balance changes the comparison
Extra ending wealth versus EUR 200/month at 5%. Saving = EUR 300/month at 5%; return = EUR 200/month at 6%. Hypothetical EUR, zero baseline.
See the data
| Initial EUR | Extra saving benefit | Extra return benefit | Extra cash contributed: saving |
|---|---|---|---|
| 0 | 15,436.32 | 1,622.06 | 12,000 |
| 10,000 | 15,436.32 | 3,241.59 | 12,000 |
| 100,000 | 15,436.32 | 17,817.36 | 12,000 |
| 500,000 | 15,436.32 | 82,598.59 | 12,000 |
Time also changes the comparison. Starting with EUR 10,000, twenty years of extra saving add EUR 40,580.45 versus the baseline; the assumed extra return adds EUR 15,065.21. Starting with EUR 100,000, those additions are EUR 40,580.45 and EUR 64,910.61. A larger initial balance gives the rate difference more money to work on from the first month.
The familiar EUR 120,000 shortcut compares EUR 1,200 with 1% of starting capital. It ignores timing and growth. In this particular model, the initial balance where the two alternatives end equal is roughly EUR 121,647 over one year, EUR 85,298 over ten years and EUR 56,070 over twenty years. Change the contribution amounts, rates or horizon and the crossing point changes. None is a universal investing threshold.
Separate your contributions from your gains
Consider EUR 10,000 initially over twenty years. The baseline ends at EUR 107,693.87 after EUR 58,000 has been paid in. The saving alternative ends at EUR 148,274.32 after EUR 82,000 has been paid in. Its EUR 40,580.45 advantage includes EUR 24,000 of your own additional money and EUR 16,580.45 of additional investment gain. Calling the whole advantage profit would exaggerate investment performance.
Extra contributions are not investment profits
EUR 10,000 starting capital, 20 years. Separate bars show money paid in and investment gain; add the pair to obtain ending wealth. Hypothetical EUR, zero baseline.
See the data
| Scenario | Initial plus contributions | Investment gain | Final wealth |
|---|---|---|---|
| Baseline | 58,000.00 | 49,693.87 | 107,693.87 |
| Save more | 82,000.00 | 66,274.32 | 148,274.32 |
| Higher return | 58,000.00 | 64,759.08 | 122,759.08 |
The 6% alternative ends at EUR 122,759.08 with the same EUR 58,000 paid in as the baseline. Its EUR 15,065.21 advantage is additional investment gain under the assumptions. That does not make it easier to achieve. The chart shows what the specified rates produce, not a promise that a different fund, trading method or asset allocation can deliver the extra point.
Optional: reproduce the calculations
For annual effective return r, monthly rate m = (1 + r)^(1/12) − 1. With initial capital P, month-end contribution c and n months, ending wealth = P(1 + m)^n + c[(1 + m)^n − 1]/m. Investment gain = ending wealth − P − cn. If the rate is zero, ending wealth = P + cn. Retain unrounded values until presentation. The same result follows by multiplying the previous month's balance by (1 + m), then adding that month's contribution.
Seeking more return is different from reducing costs
FINRA explains that potential reward comes with risks, including market losses, illiquidity and concentration. Switching to a riskier asset can increase potential returns while widening possible losses. An additional percentage point cannot be ordered like an extra monthly bank transfer. Even the extra contributions in the saving alternative can lose value after being invested.
Reviewing costs is a different exercise. The SEC explains how transaction fees and ongoing expenses reduce money left to earn returns. Lower disclosed charges on otherwise equivalent exposure can improve the comparison without deliberately increasing market risk. But a stated one-per-cent fee reduction need not translate into exactly one extra percentage point of annual net return: timing, calculation methods and other costs matter. Transfers can also involve taxes or charges. Compare the full arrangement rather than the headline fee alone.
Finally, extra saving must fit essential expenses and access to emergency money. Reducing necessary spending or borrowing expensively to fund the EUR 100 changes the economics. The alternatives need not be exclusive: you can review costs while maintaining a sustainable contribution. A useful progress check records contributions, net performance and purchasing power separately. That makes clear whether the balance grew because you supplied more money, investments earned more, or both.
Sources and method
- SEC Investor.gov: Compound interest
- SEC Investor.gov: Compound interest calculator and its inputs
- SEC: How fees and expenses affect your investment portfolio (23 July 2025)
- FINRA: Understanding investment risk
Checked 16 October 2026. Original nominal-euro illustrations use month-end contributions and constant effective annual rates before fees, taxes and inflation. No product, expected-return estimate or personal recommendation is supplied.
Keep reading.
A cheaper share is not a cheaper companyWho really pays a tariff?
House prices fall. Why can buying cost more?
Invest €12,000 now or €1,000 a month?
Investing in Switzerland: francs, stocks and ETF currencies
Volume profile: support, resistance and stop-losses
Fear & Greed Index: opportunity or a warning?
What is the VIX? Calm stocks and rising bond yields
Big Tech is borrowing billions for AI. Why lenders now want more interest