THE IDEA IN ONE LINE
The balance attributed to mainland China fell in August 2026. Country holdings alone cannot establish an equal amount of Chinese sales or a hidden transfer elsewhere.
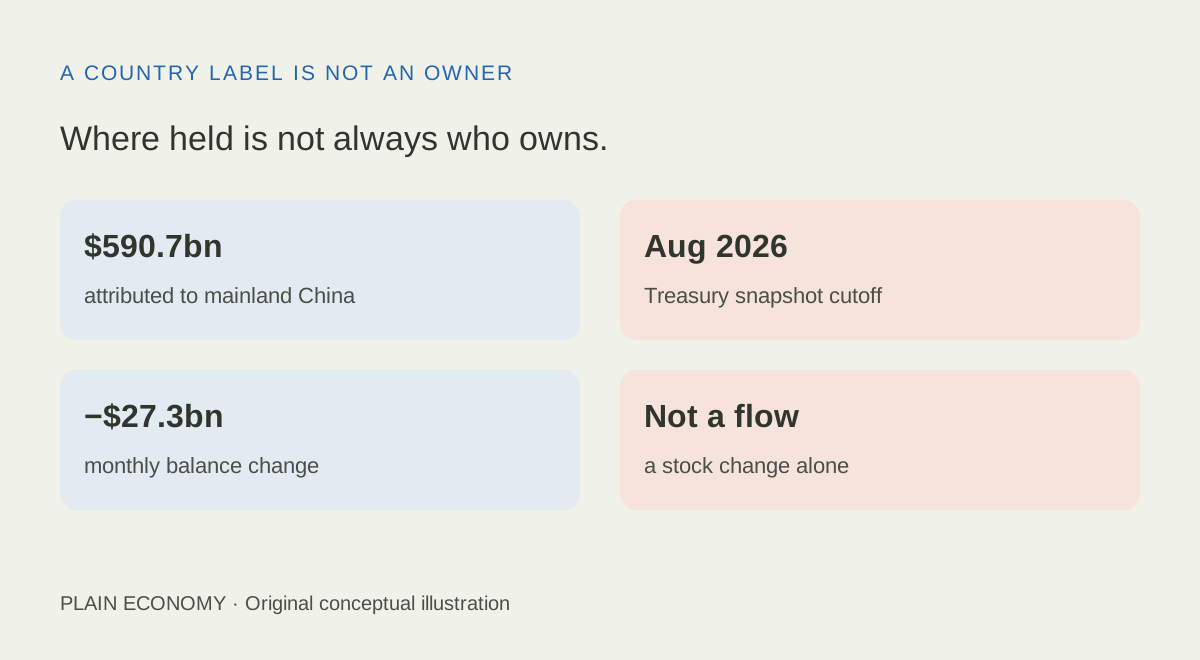
Where held is not always who owns.
$590.7bnattributed to mainland China
Aug 2026Treasury snapshot cutoff
−$27.3bnmonthly balance change
Not a flowa stock change alone
$590.7bnattributed to mainland China
Aug 2026Treasury snapshot cutoff
−$27.3bnmonthly balance change
Not a flowa stock change alone
If a warehouse in one country stores goods for customers abroad, its location does not tell you where every owner lives. Securities statistics have a related problem. A country label can reflect an intermediary visible to the reporting system. That does not make the numbers useless; it changes which conclusions they support. In the latest snapshot checked for this article, the Treasury balance attributed to mainland China fell. That fact alone establishes neither an equally large sale by its central bank nor a secret move into Canadian custody.
The published number is a position at a date
The US Treasury’s major-holder table records end-month holdings of Treasury securities by country. Its August 2026 snapshot attributes USD 590.7 billion to mainland China, down from USD 618.0 billion in July. Canada rises from USD 426.3 billion to USD 464.6 billion, and the United Kingdom from USD 998.3 billion to USD 1,009.5 billion. These are billions of dollars, not percentages or monthly purchases.
Reported country balances changed in both directions
Observed attributed Treasury holdings, USD billions, end July and August 2026. Zero baseline.
See the data
| Country | July 2026 USD bn | August 2026 USD bn | Balance change USD bn |
|---|---|---|---|
| China, mainland | 618.0 | 590.7 | −27.3 |
| Canada | 426.3 | 464.6 | +38.3 |
| United Kingdom | 998.3 | 1009.5 | +11.2 |
Subtracting China's two balances gives minus USD 27.3 billion. The correct description is a decline in attributed holdings. The table combines official and private holders, so the amount is not a separate account statement for the People's Bank of China. It also covers Treasury instruments rather than all dollar assets: deposits, equities and other securities answer different questions.
The Canadian increase is USD 38.3 billion. Placing that number beside China's decline does not identify the investor behind either movement. The amounts do not need to match, and even a perfect numerical match would not establish a connection. Many unrelated transactions can occur over the same month. A plausible story requires evidence beyond two aggregate totals.
Owner and custodian perform different jobs
Treasury FAQ 7 warns that overseas custody can obscure the country of the actual owner. A custodian safeguards and administers securities for clients; providing that service does not automatically make the institution the economic owner. Legal title and indirect holding structures depend on the arrangement. An economic explanation should not pretend that every custody system follows one universal legal form.
Our generic example has an investor in Country A owning 60 million dollars of securities and another in Country B owning 40 million. Both use the same custodian in Country C through a US correspondent. The observable reporting relationship points to C, while the assumed economic owners remain A and B. C administers 100 million; its own residents own none of these example holdings.
One custody location can serve owners in other countries
Original hypothetical ownership amounts, USD millions. Zero baseline; Country C provides custody.
See the data
| Role | Residence | Economic holding USD m | Custody/reporting location |
|---|---|---|---|
| Investor A | Country A | 60 | Country C |
| Investor B | Country B | 40 | Country C |
| Investors resident in C | Country C | 0 | Not owners in this example |
| Location-attributed subtotal | Country C | 100 administered, not owned | Country C counterparty |
If the same owner moves an unchanged holding from a custodian in C to one in D, a location-based statistic can change without the owner selling the investment. That is a possible mechanism, not a diagnosis of the China data. Establishing that it happened would require records connecting the holdings, dates and owner. None of those security-level links has been established here.
A Federal Reserve analysis explains the role of counterparties, depositories and different statistical coverage in cross-border country attribution. A fund's place of residence also differs from its investors' ultimate residences. Switching to another international database does not automatically reveal the hidden owner; instrument coverage, official versus private sectors and reporting conventions must first line up.
A falling balance need not equal net selling
Suppose a long-term portfolio starts at USD 100 million. It makes USD 5 million of net purchases, its existing bonds suffer USD 8 million of price-related valuation losses, and other reporting or custody changes subtract USD 2 million. The closing balance is USD 95 million. Its holdings fell by five even though it bought five net. All four changes in this example are assumed.
Holdings can fall even while net purchases are positive
Original hypothetical change in one long-term portfolio, USD millions. Signed zero baseline.
See the data
| Step | USD million | Interpretation |
|---|---|---|
| Opening holdings | 100 | Start of period |
| Net purchases | 5 | Transactions |
| Price valuation | -8 | Market-value change |
| Other/custody | -2 | Assumed reporting or transfer effect |
| Closing holdings | 95 | 100 + 5 − 8 − 2 |
| Net balance change | -5 | 95 − 100 |
The Federal Reserve separates changes in holdings into net transactions, valuation and other changes. Its long-term framework helps explain why subtracting two positions is not enough to measure flows. Our example is deliberately limited to a long-term portfolio. The headline Treasury table also includes short-term bills, so it would be wrong to present this illustrative bridge as an exact reconstruction of its aggregate monthly movement.
Dollar Treasury prices can change with market conditions even when the number of securities is unchanged. Translating those holdings into a foreign investor's home currency can separately change that investor's return. But a direct foreign-exchange translation is not itself the reason a dollar-denominated Treasury changes dollar value. Those two perspectives must not be mixed.
Read the label before interpreting the motive
Start by identifying the instrument, date and unit. Then ask whether the figure is an outstanding position or a transaction flow, whether it includes private investors and which institution is visible to the reporter. Check how valuation and statistical revisions are handled. Finally ask what evidence identifies the ultimate owner. A graph with a dramatic downward line does not answer those questions for you.
This discipline works in both directions. It prevents an unsupported claim that a government sold precisely the entire decline. It also prevents the equally unsupported claim that nothing was sold because all the bonds must be hidden elsewhere. Reporting limitations create uncertainty; they do not supply evidence for a preferred explanation.
Reserve diversification is a separate topic. Official gold quantities and values have their own definitions and reporting dates. A September gold increase cannot be paired mechanically with an August Treasury decline to prove that one financed the other. Gold, currency deposits and securities can belong to different portfolios or sectors, and their reported valuations can move for different reasons.
For this article the observed cutoff is August 2026, checked on 17 October; later releases or revisions can change the snapshot. The defensible finding is narrow but useful: the attributed mainland-China balance declined. Determining who traded what, through which intermediary and why requires additional evidence. That is the difference between reading a statistic and turning it into a claim the statistic cannot support.
Optional: reproduce the balance arithmetic
China: 590.7 − 618.0 = −27.3 USD billion. Canada: 464.6 − 426.3 = +38.3. UK: 1,009.5 − 998.3 = +11.2. In the hypothetical long-term portfolio, closing holdings = 100 + 5 − 8 − 2 = 95 USD million. A balance change combines components; it is not a standalone measure of net transactions.
Sources and method
- US Treasury: major foreign holders, August 2026 snapshot
- US Treasury: TIC FAQ 7 on geographic attribution
- Federal Reserve: cross-border securities positions (13 February 2026)
- Federal Reserve: valuation changes in portfolio holdings (18 April 2024)
Sources checked 17 October 2026. Observed Treasury snapshot ends August 2026 and was checked 17 October. Two other figures are original hypothetical examples, not reconstructions of China’s transactions.
Keep reading.
How to compare wages and investment returns fairlyWhy do central banks buy gold?
Gold rises, but the hedge loses
Buying at market highs: how much does time matter?
Is university worth it? What salary averages hide
A cheaper share is not a cheaper company
Who really pays a tariff?
Save €100 more or earn one percentage point more?
House prices fall. Why can buying cost more?
Invest €12,000 now or €1,000 a month?
Investing in Switzerland: francs, stocks and ETF currencies
Volume profile: support, resistance and stop-losses
Fear & Greed Index: opportunity or a warning?
What is the VIX? Calm stocks and rising bond yields
Big Tech is borrowing billions for AI. Why lenders now want more interest