THE IDEA IN ONE LINE
A wage is income earned over time; capital is an amount owned at a date. Compare matching periods and bases, and separate new savings from investment gains.
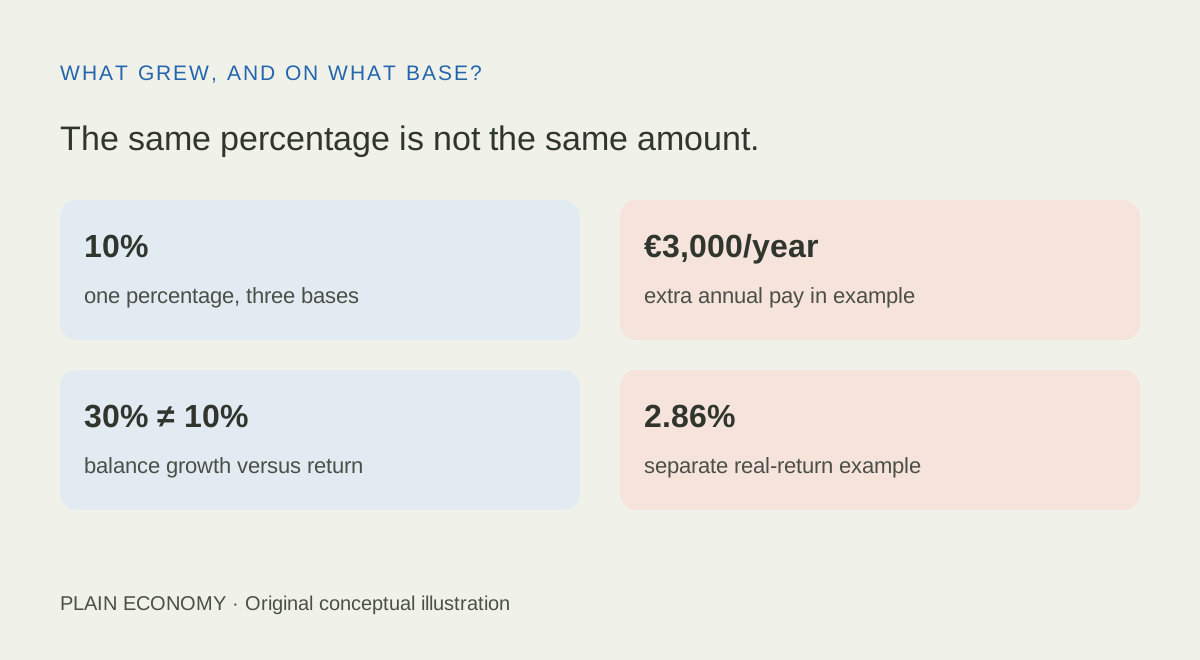
The same percentage is not the same amount.
10%one percentage, three bases
€3,000/yearextra annual pay in example
30% ≠ 10%balance growth versus return
2.86%separate real-return example
10%one percentage, three bases
€3,000/yearextra annual pay in example
30% ≠ 10%balance growth versus return
2.86%separate real-return example
Your annual pay rises 10%, and your investment earns 10%. Have they made you equally better off? The answer depends on the amounts behind those percentages, the period and what money you added yourself. A wage-growth rate describes a changing income stream. An investment return describes a gain or loss relative to capital already committed. Both can be measured usefully, but putting them on one chart does not make them interchangeable.
Income arrives over time; capital is owned at a date
The Congressional Research Service distinguishes income measured over a period from wealth measured at a point in time. EUR 30,000 a year in pay is a flow. EUR 10,000 held in a portfolio on 1 January is a stock. A 10% rise in the annual pay rate is not a 10% return on a freely tradable salary asset.
Imagine take-home annual pay increasing from EUR 30,000 to EUR 33,000, with unchanged hours and the new rate applying for the whole comparison year. The increase is EUR 3,000 per year. A EUR 10,000 portfolio earning 10% over that year gains EUR 1,000. A EUR 100,000 portfolio at the same return gains EUR 10,000.
The same 10% applies to very different starting amounts
Additional euros over the same hypothetical year: pay increase per year versus one-year investment gains. Zero baseline.
See the data
| Measure | Starting amount and unit | Ending amount and unit | Change | What changed |
|---|---|---|---|---|
| Annual take-home pay | EUR 30,000/year | EUR 33,000/year | 10%; EUR 3,000/year | Annual labour-income flow |
| Small portfolio | EUR 10,000 at start | EUR 11,000 at end | 10%; EUR 1,000 gain | Capital over one year, no external flows |
| Larger portfolio | EUR 100,000 at start | EUR 110,000 at end | 10%; EUR 10,000 gain | Capital over one year, no external flows |
For this first example, all amounts are assumed already net of relevant taxes and costs. No tax rate is being proposed. The portfolios have no deposits or withdrawals. The comparison isolates the starting-base problem: a single percentage gives different money changes, and extra annual pay remains a different measure from a gain on a stock of assets.
Labour income requires work and carries employment risk. Investment gains require ownership of capital and carry loss risk. A 10% return in this example is neither a forecast nor a sustainable spending rule. To ask whether capital can replace pay, examine actual distributions and planned asset sales after costs, alongside the risk of needing cash when prices are depressed.
Depositing wages is not the same as earning a market return
Suppose an account begins the year with EUR 10,000 and earns EUR 1,000 before any external cash flow. At the exact year-end, after that performance, you deposit EUR 2,000 of savings. The statement now shows EUR 13,000. The balance has grown 30%, but the invested money earned 10%.
A 30% larger balance does not establish a 30% return
Hypothetical one-year account amounts, EUR. Zero baseline; the EUR 2,000 deposit arrives at the exact end, after performance.
See the data
| Step | EUR | Timing or interpretation |
|---|---|---|
| Opening portfolio | 10,000 | Start of year |
| Investment gain | 1,000 | Earned before deposit |
| Savings deposited | 2,000 | Exact end of year, after performance |
| Closing portfolio | 13,000 | Immediately after deposit |
| Account growth | 30% | 13,000 / 10,000 − 1 |
| Investment return | 10% | (13,000 − 2,000 − 10,000) / 10,000 |
Timing makes this calculation simple. Because the new savings arrive at the end, they had no opportunity to earn the year's return. If they instead arrived at the very start and the full EUR 12,000 earned 10%, the gain would be EUR 1,200 and the closing balance EUR 13,200. Strategy performance is still 10%; the resources exposed to it differ.
FINRA distinguishes time-weighted performance from money-weighted returns that reflect investor cash flows. The GIPS handbook describes linking subperiod returns around external flows to measure time-weighted performance. You do not need those methods for the deliberately simple end-year deposit. With contributions throughout a real year, however, their dates matter: merely subtracting total deposits from the final balance and dividing by opening money is not a generally valid return formula.
The deposit can come from wages. Labour income and capital accumulation therefore work together in this example. Crediting the whole EUR 3,000 account increase to investing erases the worker's EUR 2,000 contribution. Crediting it all to saving erases the market gain. A useful account statement separates the two.
A price chart leaves out part of the investment outcome
FINRA explains that total return combines changes in market value with investment earnings, and that comparable returns need consistent periods. Consider a separate, explicitly before-tax-and-fees example. You invest EUR 100; the holding's year-end market value is EUR 105, after all price movements, and you receive EUR 3 in cash dividends at the end. That cash is not reinvested and remains part of your wealth.
Price, total and real return describe the same investment
Separate hypothetical gross one-year EUR investment, before tax and fees. Percent, zero baseline.
See the data
| Measure | Calculation | Result |
|---|---|---|
| Nominal price return | (105 − 100) / 100 | 5.00% |
| Nominal total return | (105 + 3 − 100) / 100 | 8.00% |
| Real total return | 1.08 / 1.05 − 1 | 2.86% |
The price return is 5%, but total return is 8%. If inflation over precisely the same year is 5%, real total return is 1.08 divided by 1.05, minus one: approximately 2.86%. Simply subtracting gives three percentage points, a useful approximation rather than the exact result. This gross example is separate from the assumed net amounts in the first chart.
A dividend is not an extra gift independent of all market adjustments. Here the ending price and separate received cash are stipulated together. Real index total-return series commonly use a stated reinvestment method, which must be checked before comparing them with a price-only series. Likewise, an unrealized price gain is not automatically recurring spendable cash. BEA excludes capital gains from its national-accounting definition of income and saving; that is a statistical convention, not a universal tax rule.
A fair chart needs more than a shared starting line
Setting wage and stock series to 100 on the same date is legitimate for comparing their measured growth. It does not show equal initial resources or turn wages into investable principal. Specify the question first: growth in a typical pay measure, wealth accumulated by a particular person, or returns on an existing portfolio. Those are different experiments.
BLS defines usual weekly earnings and distinguishes median earnings from an arithmetic mean. Its usual earnings measure is before tax and deductions, includes usual overtime and certain variable payments, and excludes the cash value of benefits such as employer health insurance. A label such as average salary is therefore insufficient: the population, pay frequency, hours, mean or median and benefit treatment need identifying.
BLS also explains that average earnings can move when the employment mix changes. A series covering successive groups of workers is not the career history of one individual. Job loss, reduced hours and movement between industries can change what the average represents. Similarly, an index is not a personal account with the investor's particular deposits, fees and purchase dates.
Use identical start and end dates, distinguish cumulative growth from annualized returns, and state currency and exchange-rate treatment. Put both sides on a matching nominal or real basis with a named price index, then align tax, fee and benefit treatment. Our pay and purchasing-power explainer covers the household inflation calculation separately.
A disciplined comparison does not establish that work is pointless or that stocks always outperform wages. It establishes what was actually measured. Before accepting a dramatic chart, ask what grew, on what base, over which dates, and how much of the increase the person supplied. Those questions turn an attractive percentage into an interpretable economic claim.
Optional: reproduce the timing and return calculations
End-year deposit example: balance growth = 13,000/10,000 − 1 = 30%; investment return = (13,000 − 2,000 − 10,000)/10,000 = 10%, exact only for the specified end-period contribution. In the separate gross example, total return = (105 + 3 − 100)/100 = 8%; real total return = 1.08/1.05 − 1 ≈ 2.8571%. All periods are one year. No historical wage, equity, inflation or tax series is asserted.
Sources and method
- Congressional Research Service: personal income
- BLS: earnings definitions and median
- BLS: real earnings technical note
- FINRA: return and rate of return
- FINRA Regulatory Notice 20-21: return methods
- CFA Institute: GIPS handbook, return calculation methods
- BEA: why capital gains are excluded from NIPA income
Sources checked 17 October 2026. Three original hypothetical one-year euro examples, not historical wage or index data. The first assumes net amounts; the final return breakdown is separately before tax and fees.
Keep reading.
Why do central banks buy gold?Is China selling US debt or changing its custodian?
Gold rises, but the hedge loses
Buying at market highs: how much does time matter?
Is university worth it? What salary averages hide
A cheaper share is not a cheaper company
Who really pays a tariff?
Save €100 more or earn one percentage point more?
House prices fall. Why can buying cost more?
Invest €12,000 now or €1,000 a month?
Investing in Switzerland: francs, stocks and ETF currencies
Volume profile: support, resistance and stop-losses
Fear & Greed Index: opportunity or a warning?
What is the VIX? Calm stocks and rising bond yields
Big Tech is borrowing billions for AI. Why lenders now want more interest